▦
Power BI
Interactive dashboards, DAX measures, data modeling and KPI reporting.
DATA ANALYST • BUSINESS INTELLIGENCE • DATA VISUALIZATION
I'm Bavly Saad Fahmy, a Computer & Information student and aspiring Data Analyst focused on data analysis, visualization, dashboards, and business intelligence.
CURRENT FOCUS
Business Intelligence · Data Visualization · Reporting
01 — ABOUT ME
Computer and Information student at Assiut University with a strong interest in Data Analytics, Databases, and Project Management, along with a foundation in Web Development and programming. Currently developing my technical, analytical, and communication skills through the Digital Egypt Pioneers Initiative (DEPI) – Data & Business Analytics Track. I have studied and practiced various programming languages, database technologies, web development tools, and project management concepts through academic studies, professional training, and hands-on projects. I am continuously expanding my knowledge and interested in applying technology and data to understand problems, support decision-making, and develop practical solutions.
02 — SKILLS
Interactive dashboards, DAX measures, data modeling and KPI reporting.
Data cleaning, PivotTables, PivotCharts, formulas and analytical reporting.
Working with relational data, queries, database design and analysis.
Developing Python skills for data analysis, processing and problem solving.
Building clear visual stories that help users understand performance and trends.
Requirements gathering, problem solving and communicating data-driven findings.
03 — PROJECTS
A growing collection of practical work focused on analysis, visualization and decision support.
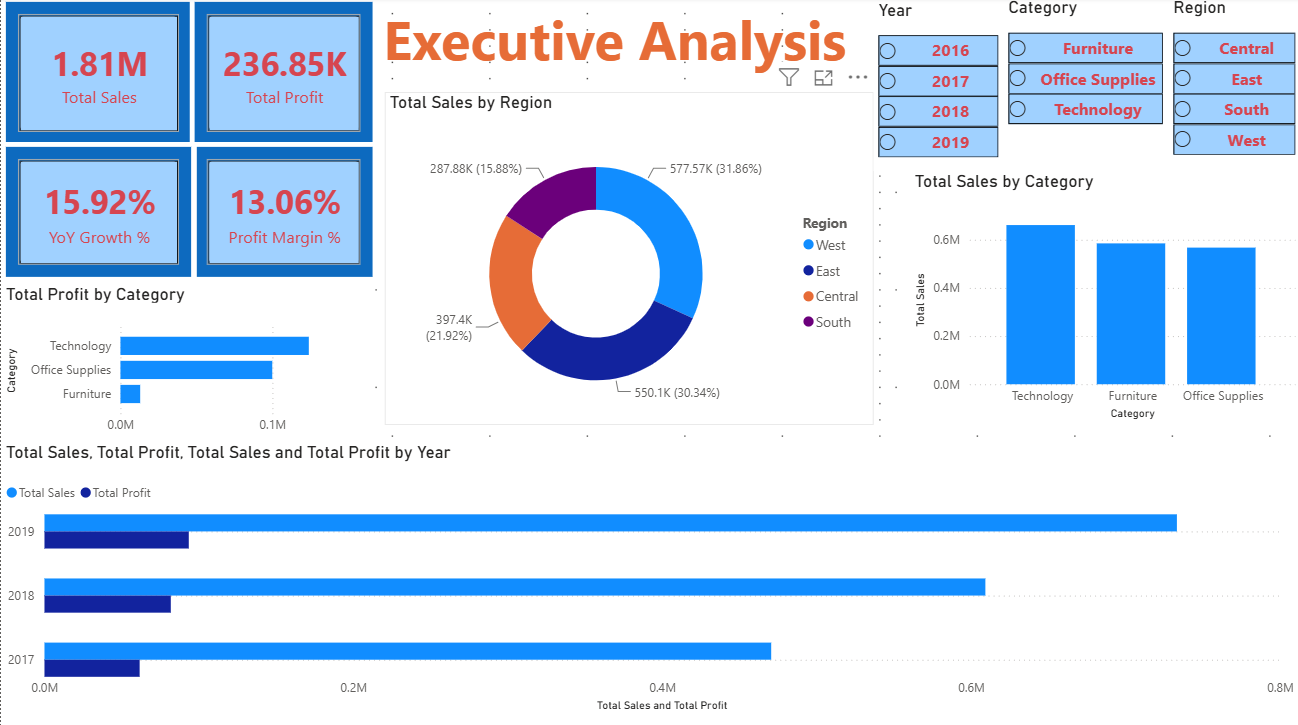
BUSINESS INTELLIGENCE
Built an interactive Power BI dashboard for management reporting, including data modeling, KPI calculations, DAX measures, dynamic filtering and product-level analysis.
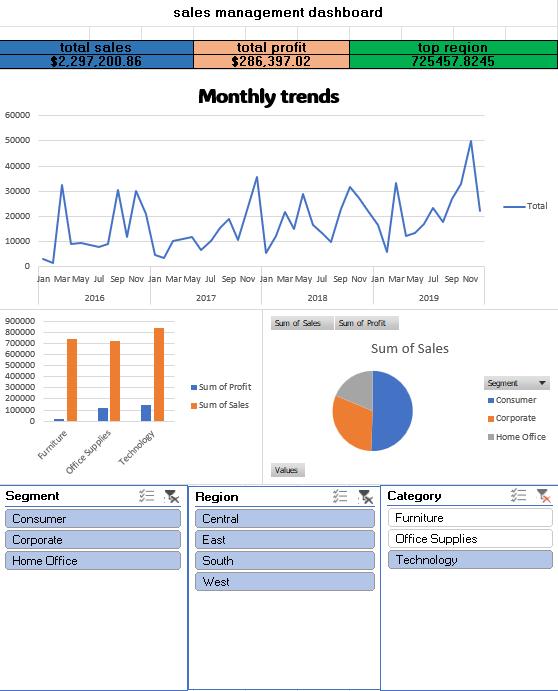
DATA ANALYSIS
Designed a retail reporting workflow using Power Query, PivotTables, PivotCharts, KPI cards and interactive slicers.
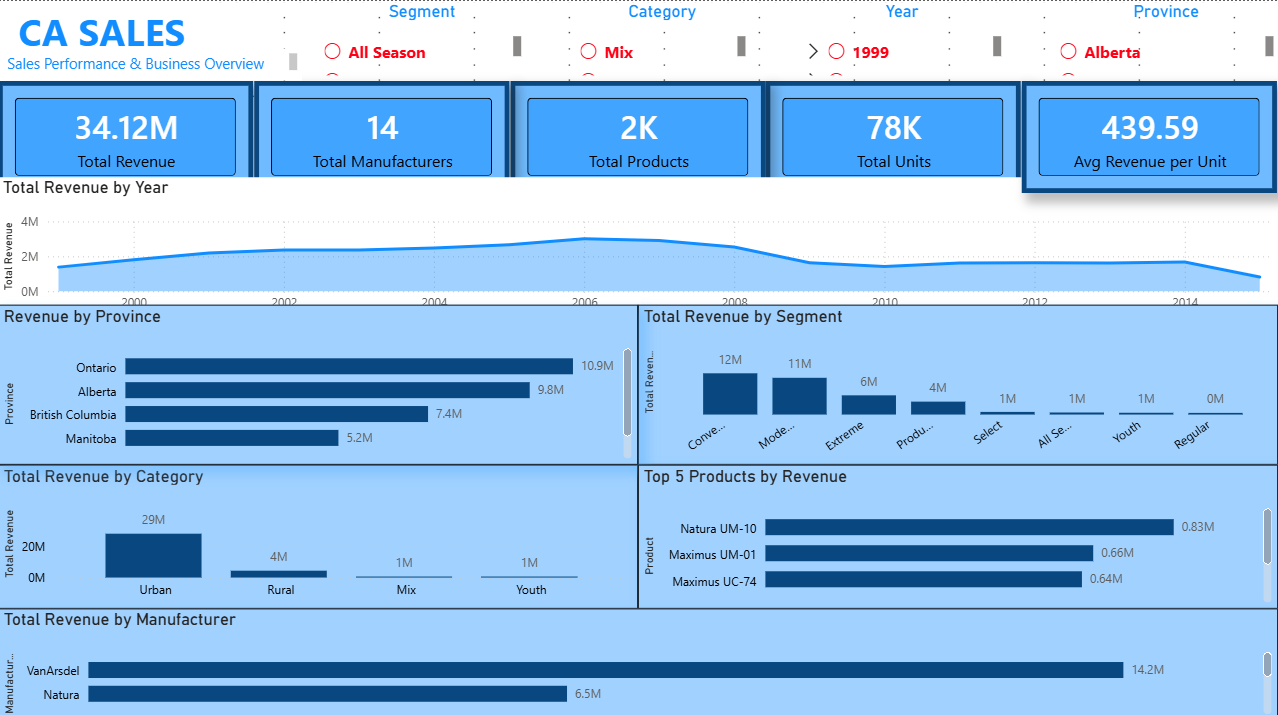
EXPLORATORY ANALYSIS
Cleaned and transformed passenger data and created meaningful categories and visual analysis in Power BI.
More projects will be added as I complete SQL, Python and DEPI projects.
04 — EDUCATION
Faculty of Computers & Information — Information Systems, Senior / 4th Year.
Data & Business Analytics Track — developing practical skills in data analysis, visualization and business intelligence.
LET'S WORK TOGETHER
I'm interested in data analysis, dashboards, business intelligence and practical analytics projects.
Get In Touch05 — CONTACT
Replace the placeholder links below with your real profiles before publishing.
PROJECT CASE STUDY